
Qualifying can make or break a drivers weekend. It is where the foundations of the race are set and could mean you end up throwing a cup at the TV while telling your friends ‘I won’t watch this one, he won’t make it from P16’. But it also gives a strain of hope – P4,P5, can the driver still win? In which grid does it go from possible to need a bloody miracle to win. This ‘hope’ can be determined by data…somewhat.
A lot can happen in a race. Strategy, Weather, someone deciding to bomb into you at the first corner. And that’s why I struggled to pin down my first question for this blog. F1 can be analysed but can’t be predicted and how a driver finishes is a minefield. I found myself getting wrapped around how a driver thinks with maximising apexes, tyre strategy and the sweetspot of a car. For my first blog post I needed to start with the basics.
Instead of trying to predict the unpredictable, I will focus on two core facts: starting and finishing position. These alone can give endless results. In this post I will look at which drivers gained or lost places compared to the rest of the field, put the grid positions under the spotlight and examine their history, and reflect on exceptional times a driver went beyond what the numbers suggested.
Methods
For this analysis I used the Formula 1 World Championship (1950-2024) dataset from Kaggle using the specific tables – Races, Results and Drivers.
My goal for this analysis was to be able to apply the SQL commands I’d learnt and create queries to gather insights. To start, my colleague suggested DBeaver as an open source database where I could access all types of SQL. I settled on SQLite as I had learnt the syntax for this.
It took me a week to finally learn how to upload the dataset into DBeaver. A lot of trial and error. And then, I made my CTE (originally my reaction was what the hell is a CTE and started to realise I was way over my head).
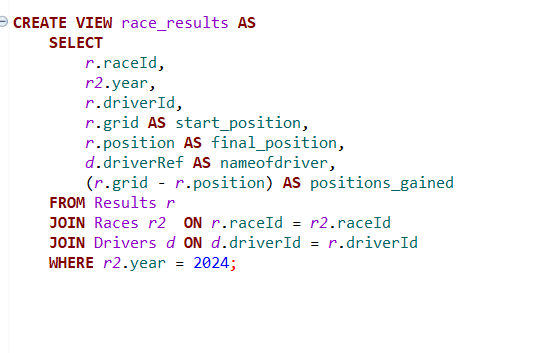
To reduce the complexity of the analysis, I wanted to only focus on the 2024 dataset for the majority. I also excluded drivers who participated in less than 20 races in the season to remove the rookies that dipped in and out throughout the season.
Key queries
For each driver did they overall gain or lose positions in the 2024 season
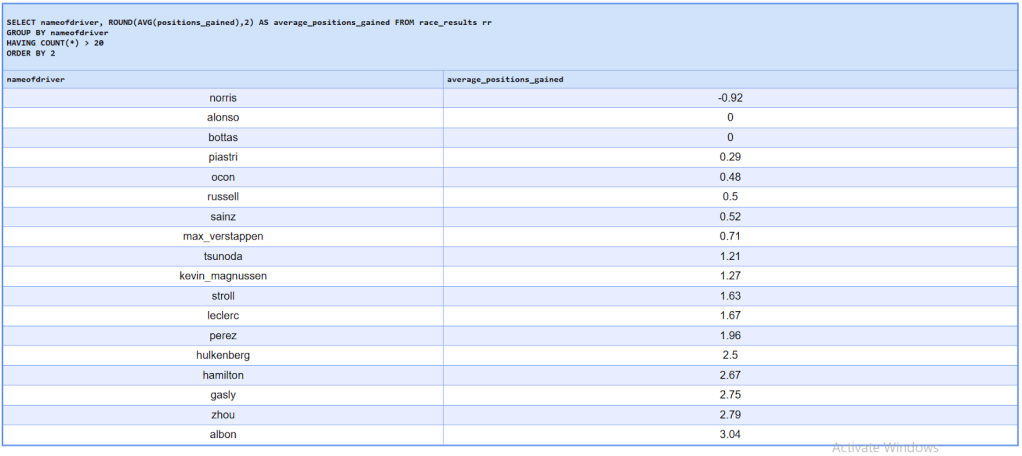
Albon recording the highest average positions gained suggests ability to outperform the expectations from his qualifying positions. In 2024 Williams struggled with balance and general technical issues during qualifying, resulting them out in Q1 for the majority of the season. But Albons gains indicate pure racecraft and opportunistic overtaking, rather than recovery drives.
Looking at the other end of the table, drivers like Lando Norris appear to under perform in this metric. This reflects the limitation rather than race performance: drivers starting on pole are capped in their ability to gain positions.
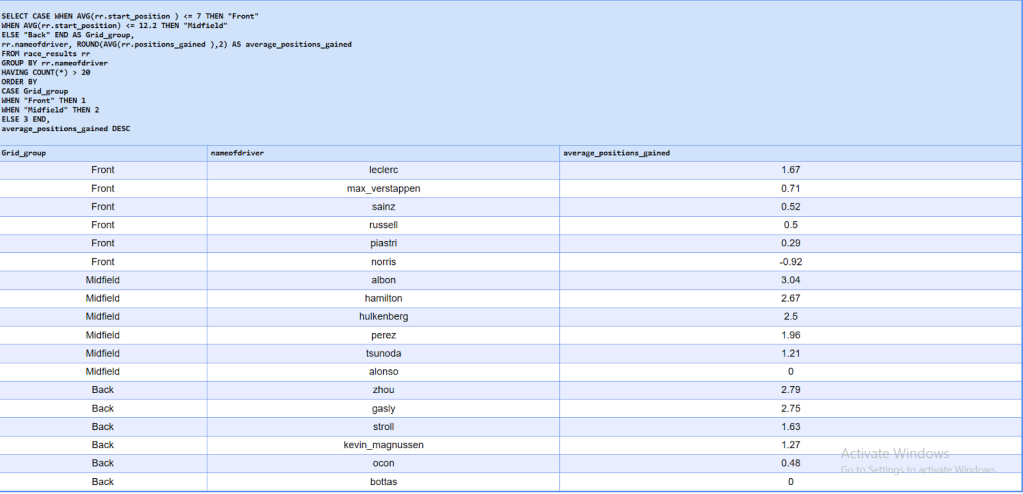
Grouping the drivers into buckets based on average qualifying position shows the majority of movement occurs in the midfield. Midfield cars are matched in performance – making it the most compressed part of the grid with cars usually within DRS range. Strategies are also more experimental as they try to get a small advantage to get 1 or 2 points. As a result, finishing positions can shift between 1-2 places.
Grid Position VS Outcome
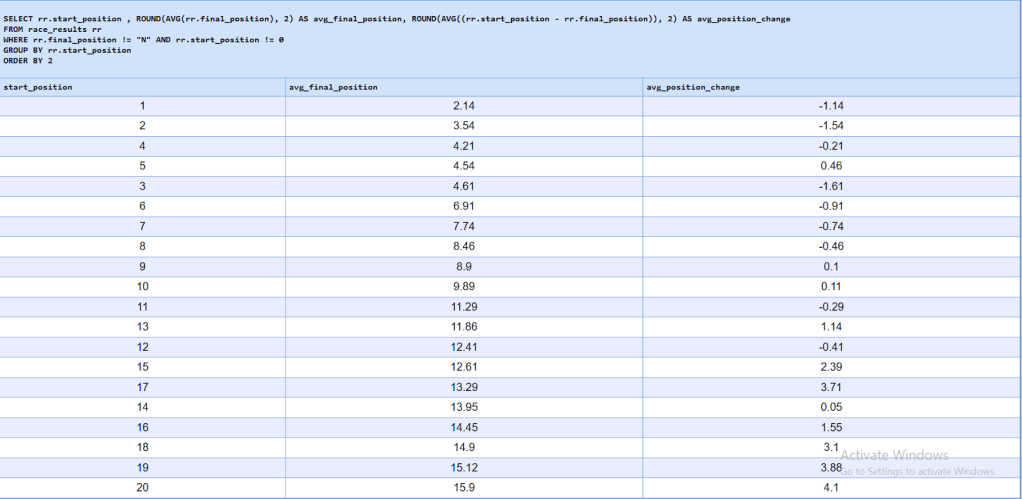
The front field (P1-P4) are inherently unstable, with a negative average position change. As stated in the previous query, their opportunity for gaining is capped. One notable anomaly is P3 which exhibits greater average positional loss than P4 or P5. This suggests P3 is a volatile position – due to first lap pressure from behind and having to compete with two big players out front.
From P13 onwards, there are positive average position changes. One caveat for this result is that DNFs highly inflate the gains, allowing them to gain positions with no overlapping. This gain is pure luck rather than racecraft.
Win probability per Grid position
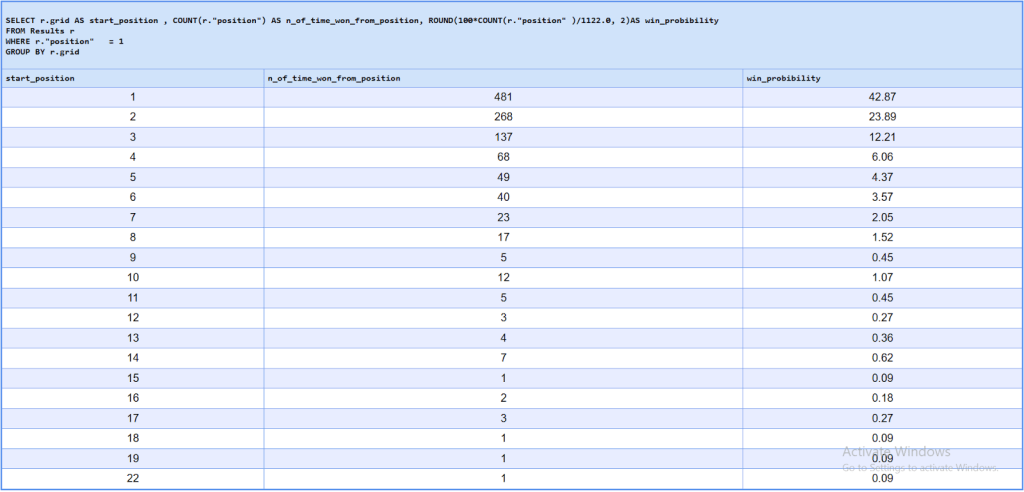
42% of races have been won from P1. with the top three grid slots accounting for 79% of wins and the top six for 92%. That statistic alone shows how a race is front-loaded, with the number of wins falling sharply after P3. This connects to earlier findings, midfield and backfield drivers gain positions on average but these rarely translate into race wins. The only way for this is an exceptional event…
Exceptional Driving in 2024
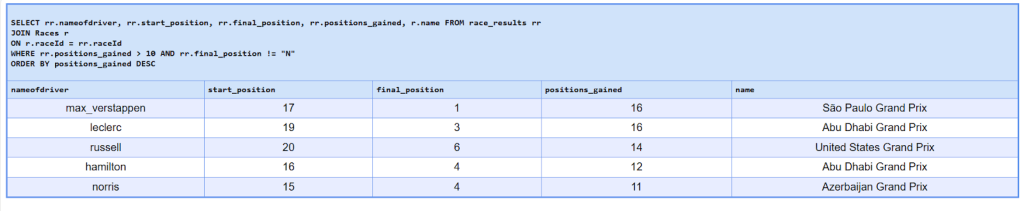
I’m sure we all remember the time when Max Verstappen qualified in P17. Starting the race, he gained 6 positions in the first lap and was in P6 by lap 12. A red flag, two safety car periods and several crashes later, Verstappen came P1 along with two shocking alpines on the podium. Now I’m no Verstappen or Red Bull fan but watching that race was truly incredible. It was also the race where Norris said that Verstappen won on ‘luck’ (later retracted for obvious reasons).
Conclusions
From these queries I can determine that the most movement in an F1 race occurs in the midfield, where drivers starting outside the top ten such as Albon, Zhou and Gasly are able to recover multiple places on average. However, with race victories overwhelmingly determined by starting position, this movement rarely translates into wins. Average position gained limits insights for front field drivers as they’re capped with their grid to gain positions.
How can I improve for next time?
This project showed me where I can take things further. I’d like to strengthen my SQL by using Window Functions in future F1 projects, especially for running totals and comparisons. It also reminded me that I want to spend more time pulling out insights, rather than simply describing what the data shows.
Next, I’m planning to explore Tableau and/or Power BI, as visualising data is a key part of analytics. I’ll also start using GitHub to share and present my code more clearly as I continue building on these projects.
